STORM Web-GIS: Mediterranean Climate Characterization for Seasonal Thermal Energy Storage

How can climate data help identify opportunities for seasonal thermal energy storage? Within STORM, UNICAMPANIA and partners are developing a Web-GIS framework that maps solar resources and heating and cooling needs across five Mediterranean countries, supporting preliminary assessments of where these systems could be implemented.

Publication Date
09/10/2026
Reading Time
3 minutes

STORM | The University of Campania Luigi Vanvitelli

Within STORM, the UNICAMPANIA team is developing together with the other project partners an advanced Web-GIS-based zonation framework to support the implementation of Seasonal Thermal Energy Storage (STES) systems across Mediterranean countries (including Italy, Spain, Cyprus, Jordan, and Lebanon) by using the leading open-source GIS platform QGIS.

Climatic conditions represent a key aspect in the preliminary assessment of Seasonal Thermal Energy Storage (STES). Web-GIS platform integrates climatic information regarding annual average solar Global Horizontal Irradiation (GHI), annual Heating Degree Days (HDD) and annual Cooling Degree Days (CDD). These parameters are selected to provide a rapid spatial characterization of the available solar resource and climatic conditions of the countries under consideration.

Web-GIS platform layers and locations

A dedicated GIS layer is created for each climatic parameter. Annual average solar GHI, annual HDD and annual CDD data are collected for selected cities of Italy, Spain, Cyprus, Jordan, and Lebanon; annual average solar GHI values are defined also for the Mediterranean countries included in the study. The cities are selected in order to represent the different climatic zones within each country, with priority given, where possible, to coastal cities located along the Mediterranean sea. The following cities are included in the Web-GIS platform: Venice, Rimini, Genoa, Livorno, Ancona, Fiumicino, Pescara, Bari, Lecce, Naples, Reggio Calabria, Olbia, Cagliari, Palermo, Trapani, Catania, Lampedusa, Barcelona, Valencia, Almeria, Palma, Granada, Paphos, Limassol, Larnaca, Amman, Ajloun, Zarqua, Ma’an, Ruwaished, Aqaba, Irbid, Madaba, Beirut, Beidittine, Zahle and Faraya.

Data Sources, weather station selection, methodology

Annual average solar GHI data are extracted from the Global Solar Atlas (https://globalsolaratlas.info/map), while annual HDD and CDD values are derived from the Degree Days.net platform (https://www.degreedays.net/). For each investigated city, the most reliable available local weather station is identified and selected as the reference source. When a reliable local station is not available, Global Grid Stations are adopted. These Global Grid Stations are based on hourly ERA5 reanalysis data provided by the Copernicus Climate Change Service (https://climate.copernicus.eu/), allowing climatic information to be obtained also for locations where direct meteorological observations are limited or unavailable.

For the calculation of the degree-day indicators, appropriate reference temperatures are defined. A base temperature of 18.0 °C is adopted for heating and 21.0 °C for cooling, in accordance with EN ISO 15927-6:2007 (https://www.iso.org/standard/35564.html) and the methodology adopted by Eurostat for energy statistics (https://ec.europa.eu/eurostat/cache/metadata/en/nrg_chdd_esms.htm). To improve the statistical robustness of the climatic characterization, daily HDD and CDD values covering a period of 36 months are processed. Annual average HDD and CDD data are subsequently calculated by summing the corresponding daily degree days and normalizing the results over the three-year reference period.

Mapped climatic parameters

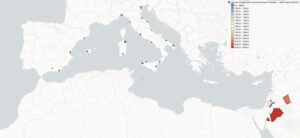
The resulting GIS layers highlighted a clear geographical variation in solar availability across the investigated Mediterranean region. Annual average GHI generally increased from north to south. As reported in Figure 1, the lowest values are identified in Northern Italy, with approximately 1400 kWh/m² in Genoa, whereas the highest solar resource is found in Southern Jordan, where values close to 2300 kWh/m² are reached in the Ma’an area. Italy and Spain showed marked internal spatial gradients, while more homogeneous distributions are observed in Lebanon and Cyprus (where annual average GHI values are mainly included between 1900 and 2100 kWh/m²).


Figure 1. Web-GIS map displaying the spatial distribution of annual average solar GHI across the investigated Mediterranean regions.

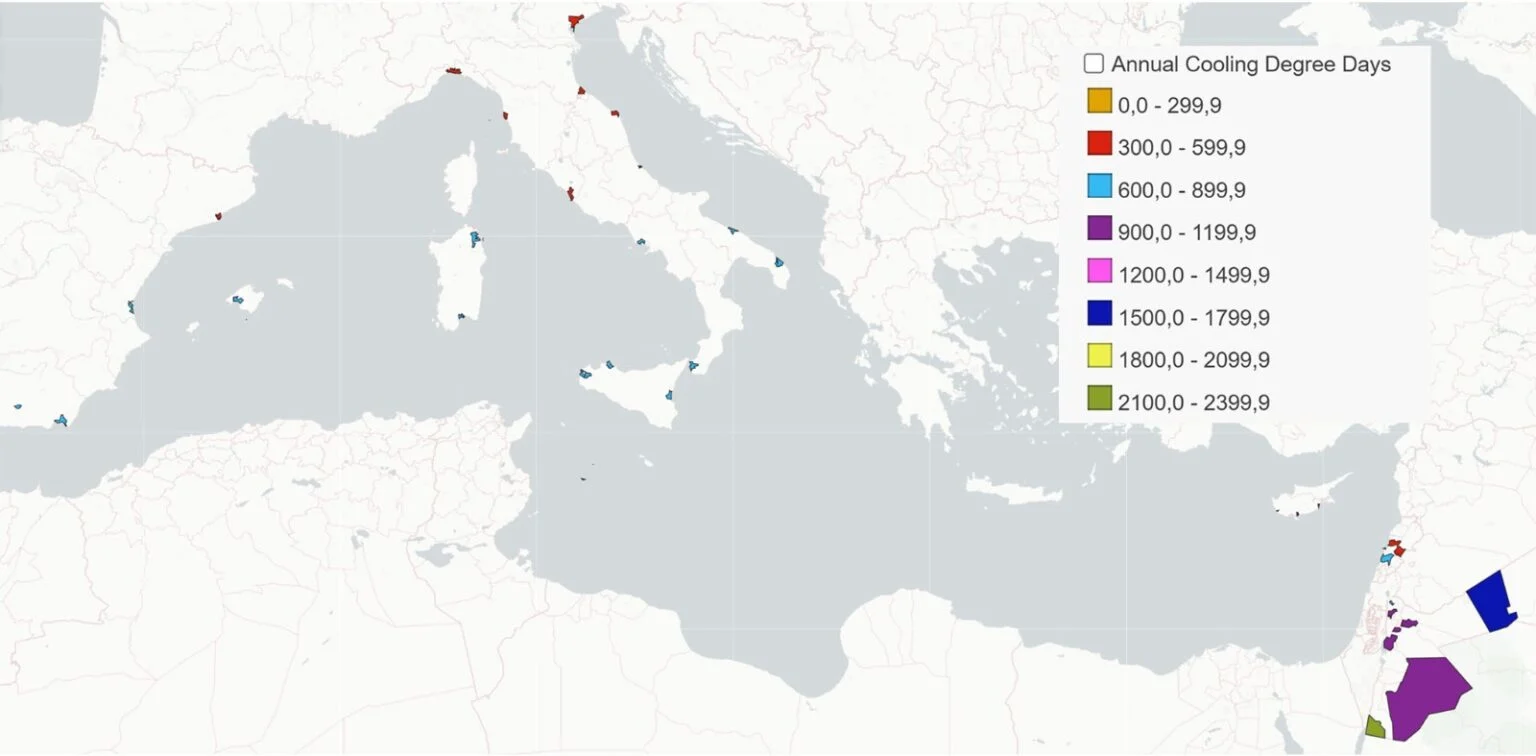
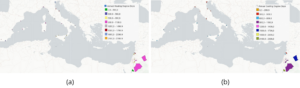
Spatial distributions of annual HDD and CDD data indicate a strong dependence on geographical position and altitude, allowing cooler northern and high-altitude areas to be distinguished from warmer southern and arid regions. The highest annual HDD and the lowest annual CDD are observed, as showed in Figures 2a and b, in Northern Italy (about 432 and 1887, respectively) as well as in the high-altitude Lebanese city of Faraya (around 485 and 1356, respectively). In contrast, the minimum annual HDD and the maximum annual CDD are concentrated in the hot, arid climate of Southern Jordan around the city of Aqaba (around 250 and 2350, respectively).


Figure 2. Web-GIS map displaying the spatial distribution of (a) annual Heating Degree Days (HDD) and (b) annual Cooling Degree Days (CDD) across the investigated Mediterranean regions.

The integration of annual average GHI, annual HDD, and annual CDD within a single interactive Web-GIS environment provides a geographically explicit climatic screening approach, through which different Mediterranean locations can be rapidly compared before carrying out more detailed analyses of solar-based seasonal thermal energy storage systems.

Last Update

09/10/2026